
Only a few countries are reporting more new coronavirus infections compared with the previous two weeks. DW sums up the global data on the current situation in three charts.
By DW
May 13 2022
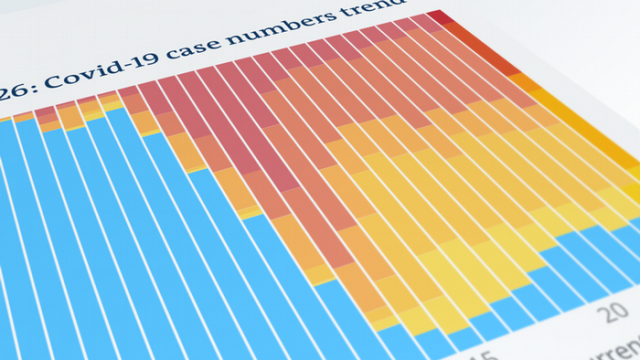
What’s the current global trend?
The goal for all countries is to make it to the blue section of the chart and stay there. Countries and territories in this section have reported no new cases for four weeks in a row.
Currently, that is the case for nine out of 188 countries and territories.

How has the COVID-19 trend evolved over the past weeks?
The situation deteriorated slightly: 73 countries have reported more cases in the past two weeks compared with 14 days earlier.

What is the current COVID-19 trend in my country?
Based on the newly reported case numbers – which can reflect local outbreaks as well as nationwide spread – in the past 28 days, countries and territories classify as follows:

More than twice as many new cases:
- Asia: Cyprus, Mongolia, Saudi Arabia, Taiwan, Timor Leste
- Africa: Botswana, Cape Verde, Eritrea, Eswatini, Mauritania, Rwanda, Somalia, South Africa, Uganda, Zimbabwe
- Americas: Argentina, Belize, Dominica, Grenada, Guyana, Jamaica, Panama, Saint Kitts and Nevis, Suriname, Uruguay
- Europe: San Marino
More new cases:
- Asia: Bahrain, Brunei Darussalam, India, Nepal, Qatar, Singapore, Syria, United Arab Emirates
- Africa: Burkina Faso, Burundi, Djibouti, Equatorial Guinea, Ghana, Guinea Bissau, Kenya, Lesotho, Madagascar, Malawi, Mauritius, Morocco, Mozambique, Namibia, Niger, Nigeria, Sao Tome and Principe, Sierra Leone
- Americas: Antigua and Barbuda, Bahamas, Barbados, Bolivia, Brazil, Chile, Colombia, Costa Rica, Dominican Republic, Paraguay, Saint Lucia, Saint Vincent and the Grenadines, Trinidad and Tobago, United States of America, Venezuela
- Europe: Andorra, Moldova, Portugal, Spain
- Oceania: Australia, Solomon Islands
About the same number of new cases (no change or plus/minus 2%):
- Africa: Gambia, Guinea, Senegal, Togo
- Europe: Croatia, North Macedonia, Ukraine
Fewer new cases:
- Asia: Afghanistan, Azerbaijan, Bangladesh, Myanmar, China, Iraq, Israel, Japan, Kazakhstan, Kuwait, Lebanon, Oman, Pakistan, Philippines, Sri Lanka, Thailand, Uzbekistan
- Africa: Algeria, Angola, Comoros, Ivory Coast, Egypt, Ethiopia, Gabon, Liberia, Mali, Seychelles, South Sudan, Sudan, Tunisia, Zambia
- Americas: Canadá, Ecuador, Guatemala, Haiti, México, Perú
- Europe: Albania, Austria, Belarus, Belgium, Bosnia and Herzegovina, Bulgaria, Denmark, Finland, Germany, Greece, Hungary, Iceland, Ireland, Italy, Kosovo, Liechtenstein, Luxembourg, Malta, Monaco, Montenegro, Netherlands, Norway, Poland, Romania, Russia, Serbia, Slovenia, Sweden, Switzerland, United Kingdom
- Oceania: Fiji, Marshall Islands, New Zealand, Vanuatu
Less than half as many new cases:
- Asia: Armenia, Bhutan, Cambodia, Georgia, Indonesia, Iran, Jordan, South Korea, Kyrgyzstan, Laos, Malaysia, Maldives, Turkey, Vietnam, Palestinian territories, Yemen
- Africa: Chad, Libya
- Americas: Cuba, Honduras
- Europe: Czech Republic, Estonia, France, Latvia, Lithuania, Slovakia
- Oceania: Papua New Guinea, Samoa
Zero new cases:
- Asia: Tajikistan
- Africa: Benin, Cameroon, Central African Republic, Congo, Democratic Republic of the Congo
- Americas: El Salvador, Nicaragua
- Europe: Vatican
…
Read More: DW – COVID-19: Pandemic trends in three charts
…